Mobile contracts make your service drive faster, and Dealerware’s main dashboard makes it easy to see available cars, contract lengths and utilization rates. This at-a-glance performance tracking is a great way to status check your fleet. But if quick status checks are all you’re doing, you could be overlooking some simple tactics that can significantly improve your fleet’s utilization and your ability to recover costs.
For this post, Dealerware’s customer success team provided a detailed walkthrough of daily, weekly and monthly reporting strategies. These tactics have helped some Dealerware users increase utilization from 60% to 90% in a few months’ time, or even highlighted thousands of dollars in unrecovered costs, and you can put these tips to action today.
What to do every day
Those utilization gains aren’t outliers. Dealerware’s customer success team is confident that any dealership can significantly improve their fleet’s utilization with a little daily digging into the contract reports on the Dealerware dashboard.
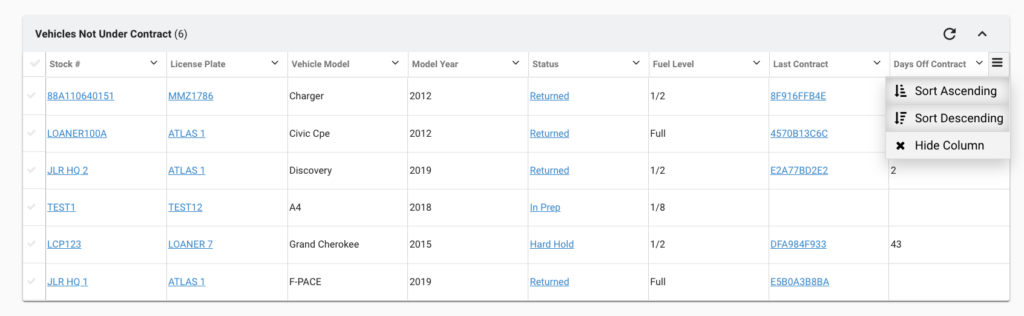
Start each day with a scan of the Vehicles Not Under Contract field, shown to the right. Here you’ll see information about each vehicle in your fleet that’s not under contract. Cars in a “returned” or “staged” state are ready to be contracted to customers, while those “in prep,” aren’t quite ready yet. Cars under a “hard hold,” don’t count against utilization.
The key field here is “Days off contract,” which you can use to quickly identify those cars that are being underutilized. You can sort the report by this field to bring to the top those cars that have been off contract the longest. From there, talk to your team to prioritize contracting these vehicles.
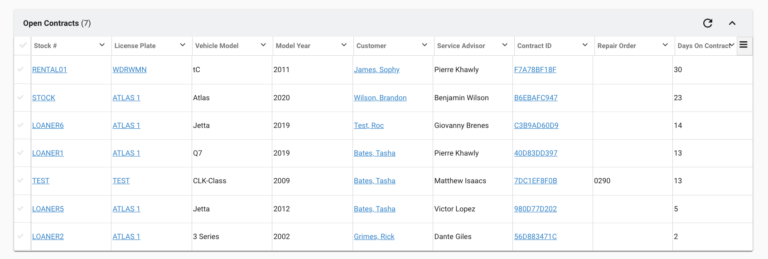
Scroll a little further on your Dealerware dashboard and you’ll find the Open Contracts report. You can take similar action here; sort the Open Contracts report by Days on Contract each morning to identify vehicles that have been with customers longer than usual. From there, you can quickly identify which service advisor wrote the contract and talk with them about delays completing a repair order, or if the customer is late getting their loaner or rental back.
Weekly reporting makes your team better
Dealerware users who already use the main dashboard to track KPIs like length of loan, utilization and cost recovery can also benefit from a weekly review of each metric.

Using the gear icon on the KPI widget, shown here to the right, you can set a seven-day timeframe to view the previous week’s results in each metric. As you go through the month, this weekly look at the most important performance data will help you determine if contract lengths or time off-contract is creeping up, and you can compare the week’s utilization against your monthly average benchmark. As the weeks pass in a month, set new date ranges to view metrics month-to-date, to make sure you’re on track.
At the bottom of Dealerware’s main dashboard is the Service Advisor performance report, shown below. Our customer success team thinks this might be the most powerful weekly report you can review. As with the main KPI widget, you can view performance by service advisor over a window of time here. At the end of each week, look back at your service advisors’ tally of short and long contracts, and compare their average length of contract to your benchmarks (we say 4 days or fewer is a healthy average length of contract).
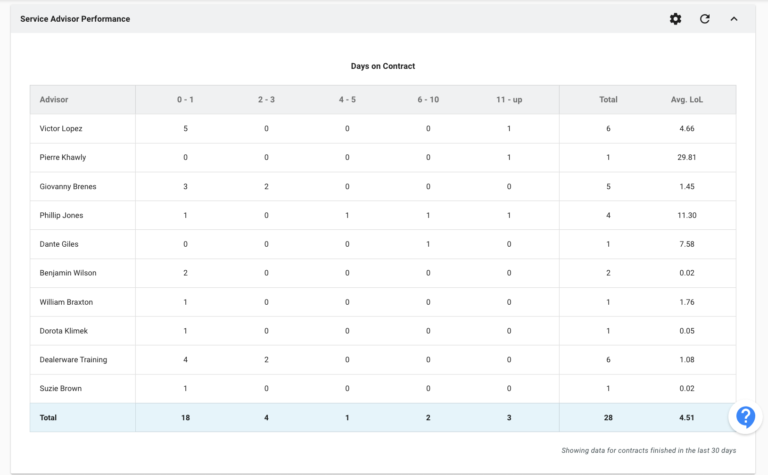
Checking in on this report weekly will allow you to intervene when a team member’s performance is slipping. If they had one or more contracts that stretched 11 days or more, talk with them to understand why and make sure that they’re communicating effectively with your customers. Similarly, if one team member stands out as a top performer, see what they’re doing differently that might help the whole team improve, or celebrate success to boost morale.
Reports for the end of the month
For day-to-day fleet management, the advice in the previous sections should help your team improve. But Dealerware can provide even more data to help your dealership run more efficiently. The dealerships with the highest utilization rates typically all turn to two reports at the end of each month: the Vehicle Inventory and Vehicle Utilization reports.
In the Vehicle Inventory report, you’ll get a detailed breakdown of everything happening with each car in your fleet. Comptrollers, dealership GMs and dealer group or OEM program administrators most often use the Vehicle Inventory report to visualize the cycling of cars into and out of loaner or rental fleets. You can review per-car utilization to understand if there are too many or too few vehicles in the fleet, then right-size the fleet to maximize per-car utilization and bottom-line impact.
The Vehicle Inventory report is also helpful to make sure that toll tags or connected car devices are installed on the correct vehicles, that license plate numbers are correct, and that vehicles are disposed from the fleet before they reach program mileage limits.
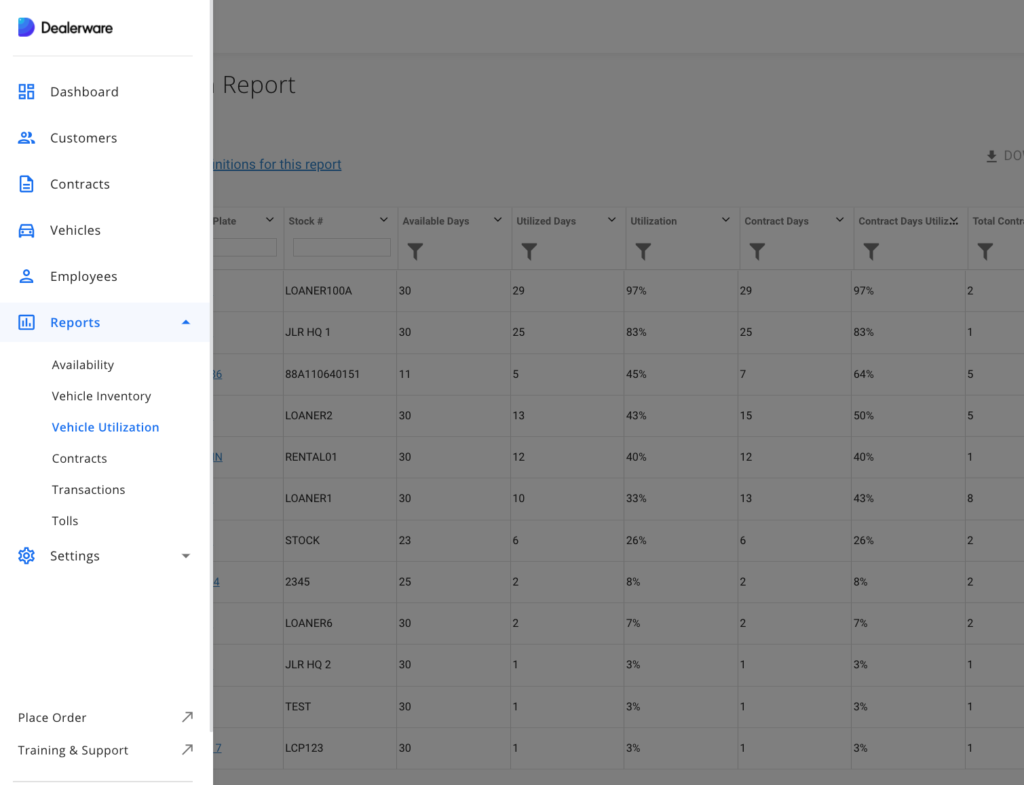
Finally, the Vehicle Utilization report provides the most detailed information about how your fleet is used day to day. From the Reporting tab in Dealerware, you can search for specific vehicles or sort the data by a dozen different parameters to quickly identify your most and least utilized vehicles, or get a quick look at the number of days each vehicle was available.
Download the Vehicle Utilization report and you’ll get even more granular data about each car’s utilization.
When downloaded, you’ll get a day-by-day look at vehicle availability, how many contracts each car served each day, and which days each vehicle was unavailable. Use this report to understand why a car sat in a hard hold for 10 days, or to identify days where a car sat unused. Armed with this info, follow up with your team to see why a vehicle is underutilized, and determine if it’s time to hand that vehicle over to your used sales department.